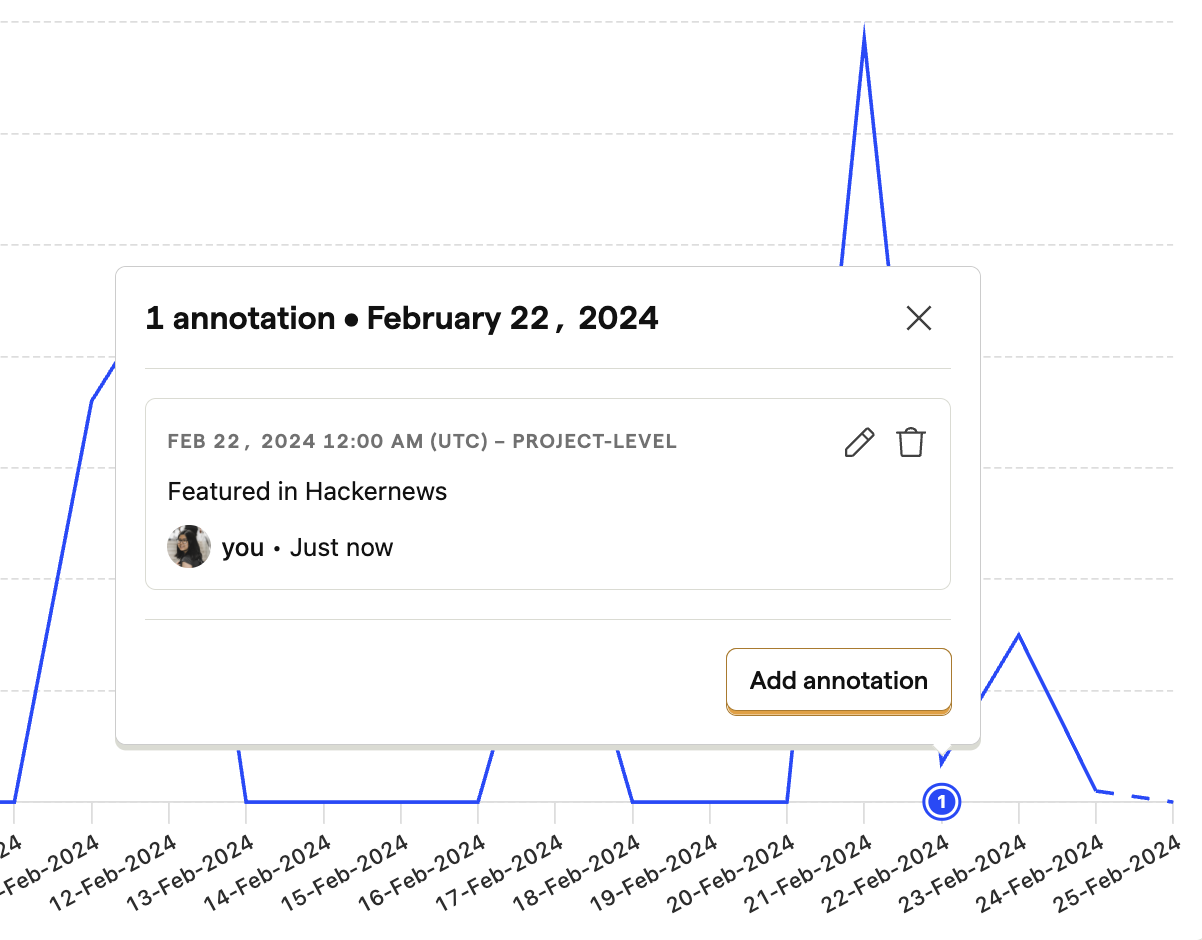
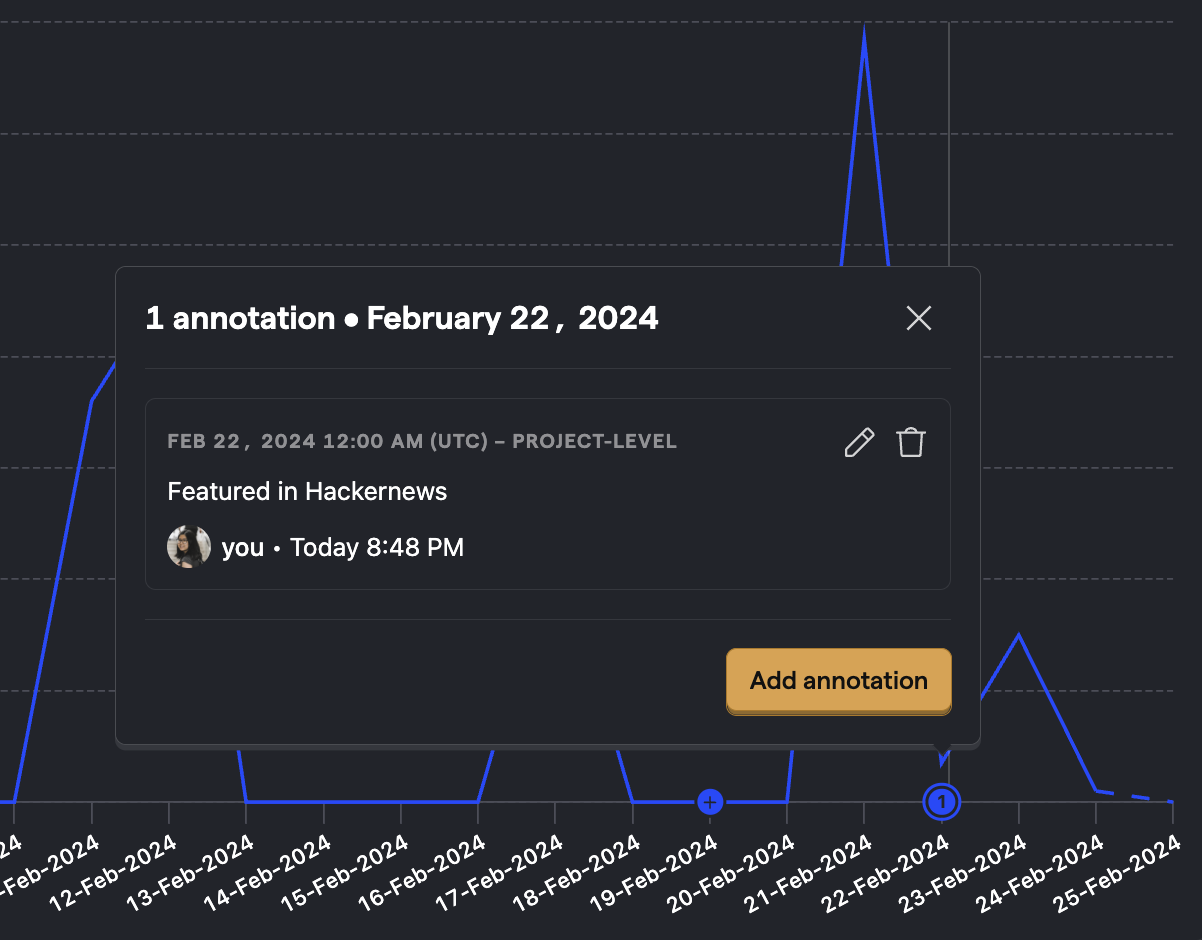
Annotations enable you to add written notes to a particular day or time on all your insights and dashboards so you can see how changes or incidents impact your metrics.
You can use annotations to mark things like feature updates, version releases, and marketing campaigns, which adds helpful context when you're looking into what might have caused a change in your metrics.
Why Annotations are useful
The chart below shows a large spike in website traffic, which has been annotated to explain why that spike occurs. Annotations can be viewed by hovering over them.


Annotations can be written after the fact, which makes them useful for future reference, or before an event if you want to analyze the future impact of a particular marketing initiative, for example.
Creating an Annotation
When editing a chart in Trends, Sessions or in a Dashboard, hover your cursor over the dates at the bottom of the chart to reveal a button with a + symbol. Clicking it will then open up a modal where you can create your Annotation, as well as choose to have it specifically for the current chart or all of your charts.
With your annotation created, it will now be available at the bottom of your chart, and you can also view all of your existing annotations in /annotations.